


The problem with content marketing is that it’s really difficult to pin down how effective it is.
After all:
- Over 50% of B2C marketers polled by the Content Marketing Institute this year said that measuring content effectiveness was the biggest challenge they faced.
- Content isn’t like more traditional forms of online marketing such as paid ads – there aren’t any easy to read graphs or charts explaining how effective a campaign is.
There’s not even a panel of expert judges who hold up score cards after every blog post to let you know how you’re doing, so you can pretend you’re an Olympic figure skater or on a popular dancing reality TV show.
Benefits to content marketing such as increased brand awareness and reputation are incredibly useful, but they’re also not particularly easy to track.
While most content marketers see a vague link between content and sales, it can be difficult nailing down what elements are working well, which is crucial to streamlining your marketing efforts.
Thankfully, though, it is possible to track your ROI from content marketing. It takes a little research and some smart planning, but it can be done.
Here are a few ideas I’ve cultivated from personal experience:
Measuring Good KPIs
I’ve found that the key to accurately tracking your content marketing effectiveness is making sure that you’re asking the right questions of the data that’s available to you.
The first step of this process involves making sure you have a clear set of measurable goals in place for your content marketing in the first place; what is it you’re trying to achieve, and how will you know when you’ve managed it?
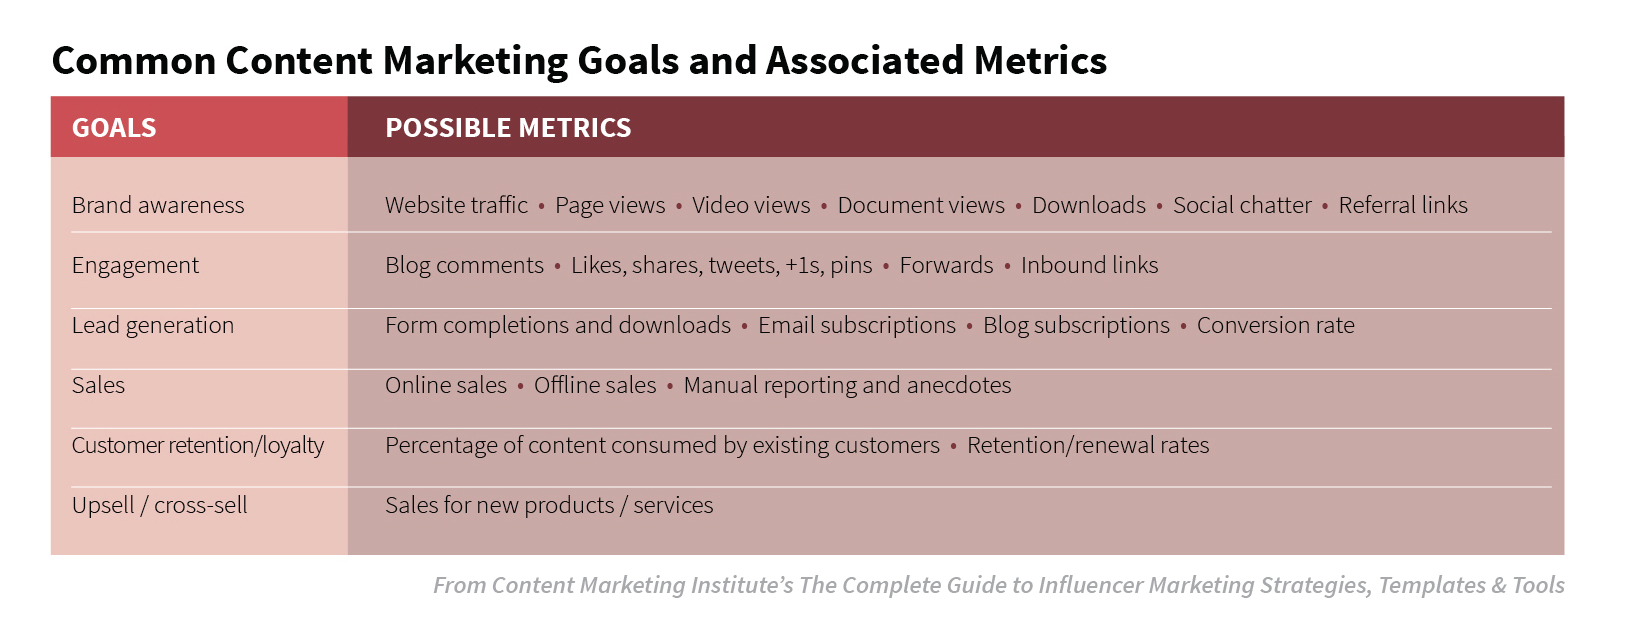
Your ultimate goal with content marketing should be increasing sales and encouraging lifelong customer commitment – a clear focus on customer conversions helps to stop content from veering away from its primary purpose.
Keeping Your Eye on the Target
Some marketers recommend the funnel approach to content marketing, wherein marketers focus on KPIs that increase purchases and customer retention by reaching out to the widest possible target demographic in the earliest stages of conversion.
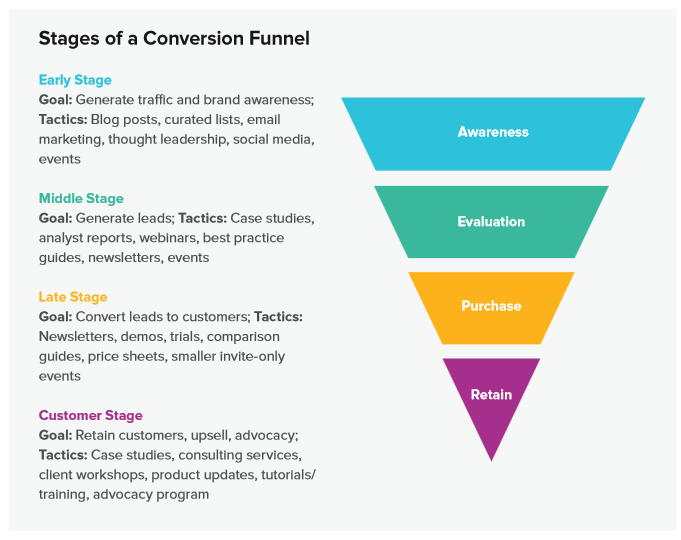
The wider the top of your funnel is, the greater your reach will become and the more potential customers you can draw in.
For this reason, many marketers looking to track their content ROI only tend to look at how far their content is travelling.
But in my experience, there are plenty of places along the conversion process that customers can get lost:
- Studies have shown that only 25% of new leads are immediately ready to purchase, and that means your content needs to provide support that helps prepare potential customers to move forward.
Because of this, it takes support at every stage in order to maximize ROI, and that means making sure that all of your content is as focused as possible on relevant KPIs.
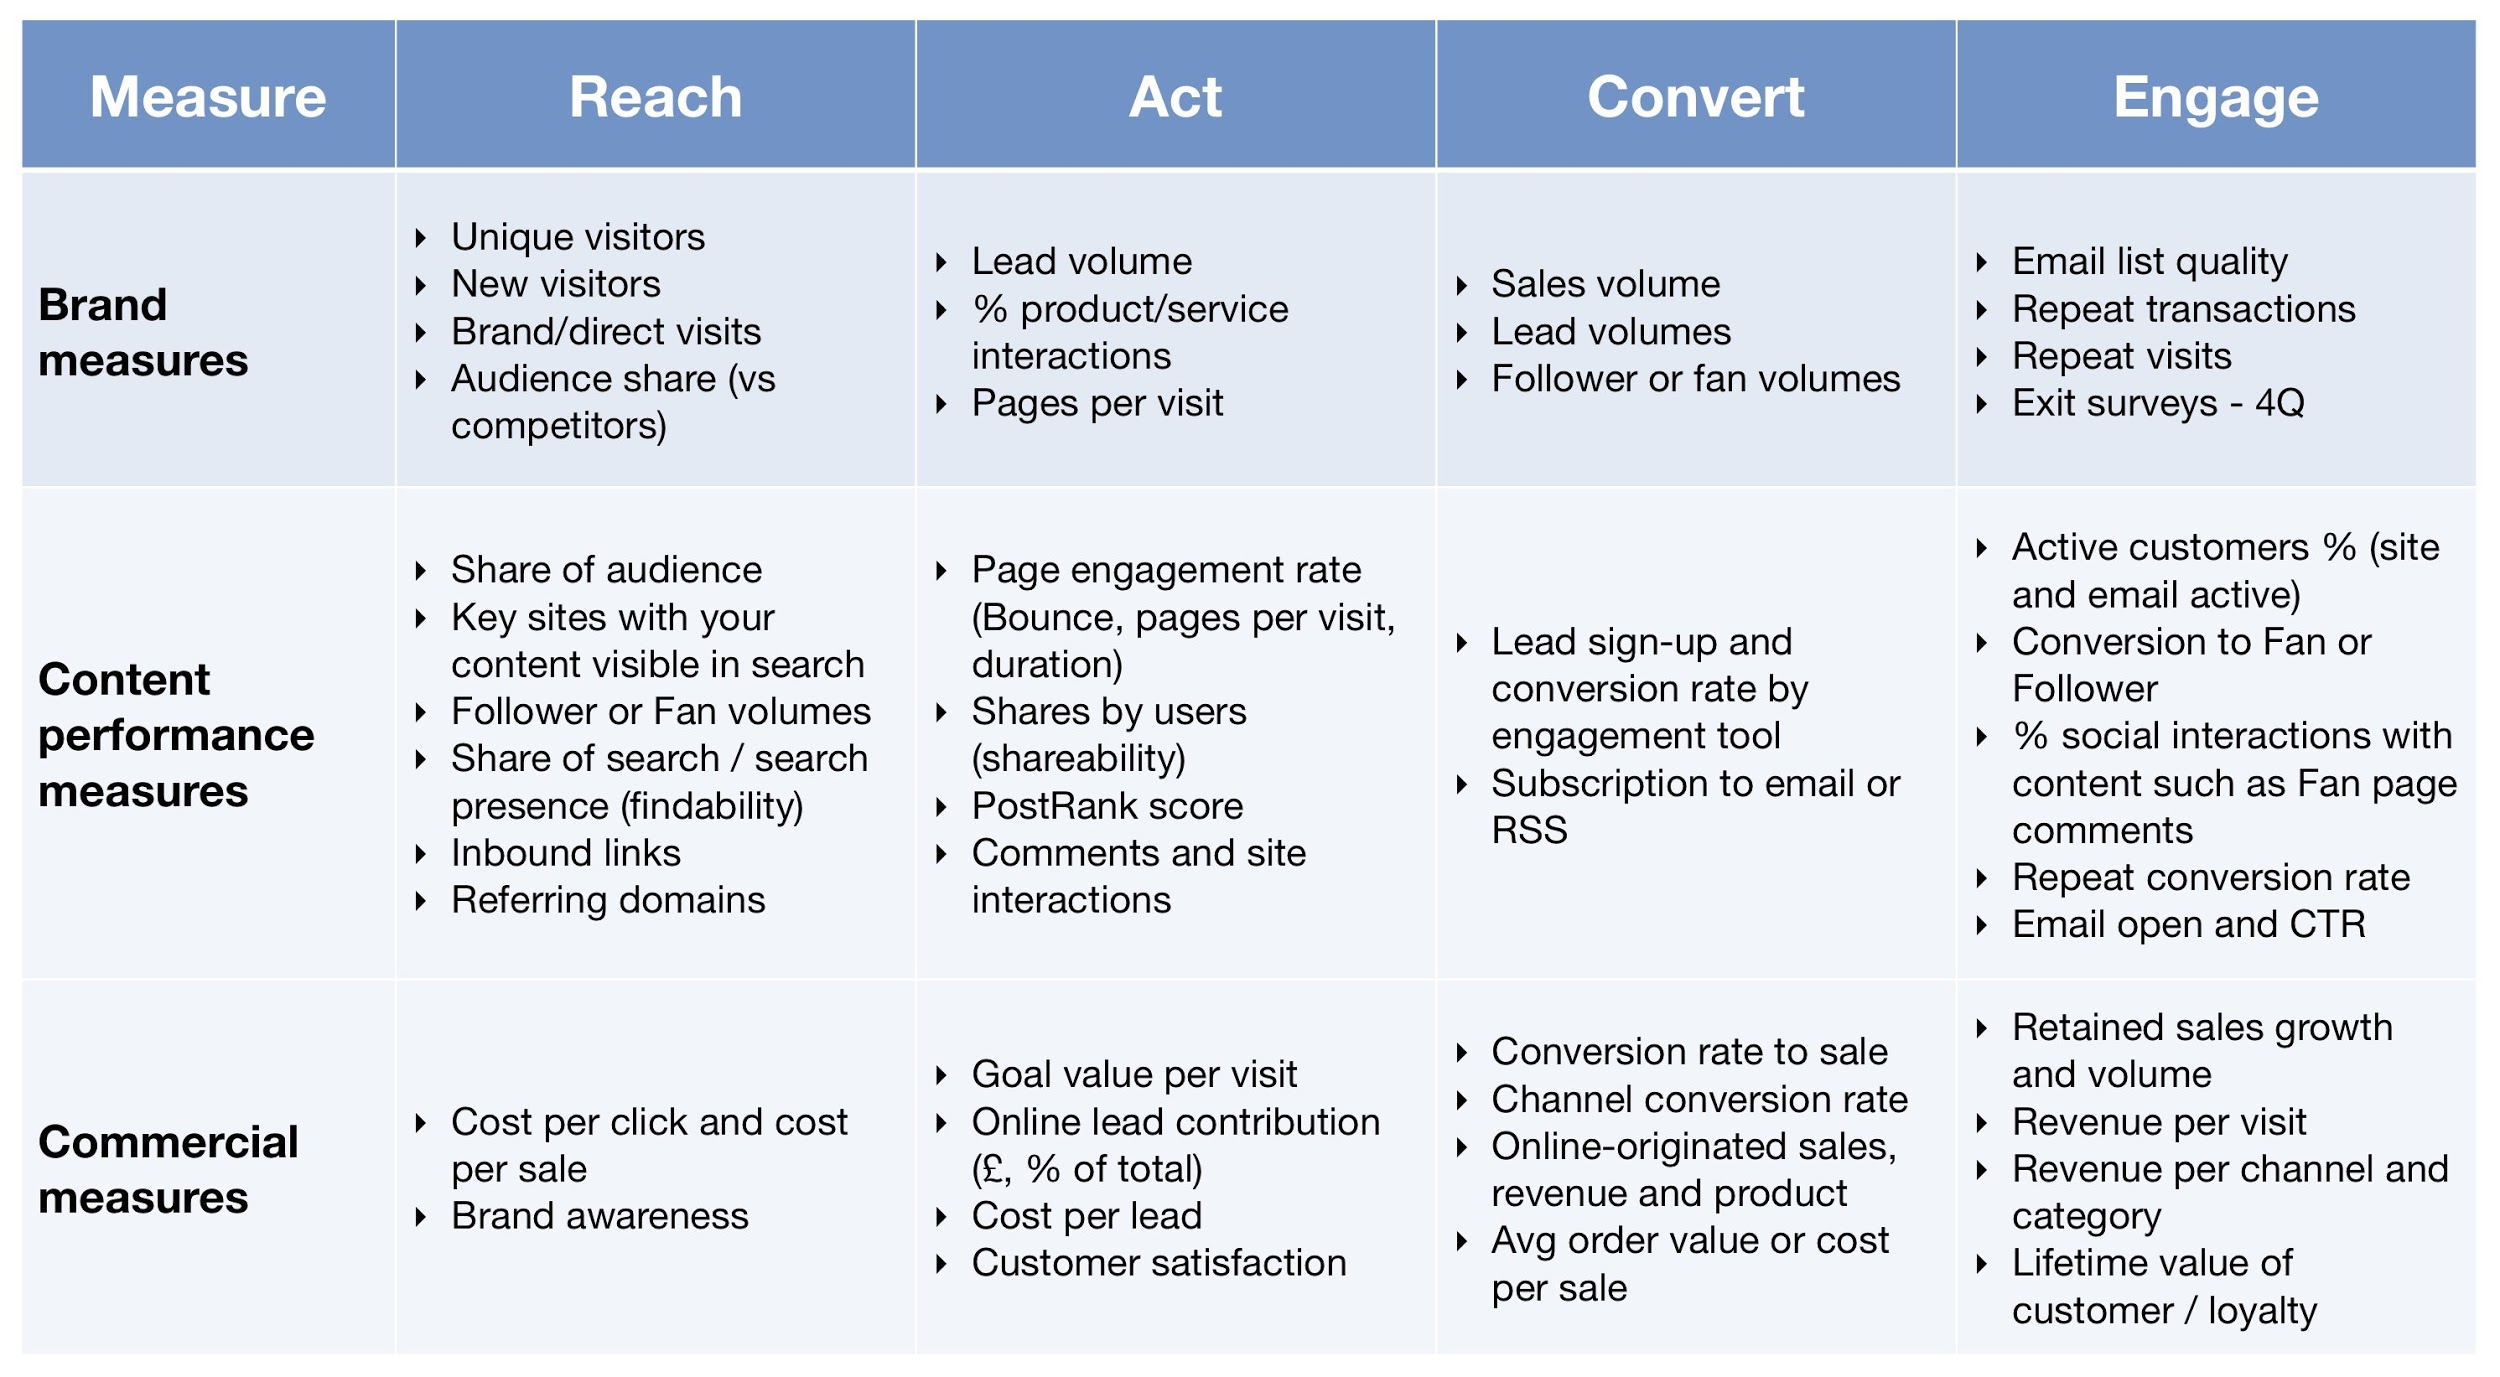
Many marketers split content marketing goals into three groups to help identify what parts of their plans are working well:
- Reach,
- engagement, and
- conversion.
These categories cover many various numerical KPIs, so keeping an eye on them can give a structured idea of the numbers behind a content marketing campaign’s rate of success.
Comparing the numbers for all three groups has the added bonus of highlighting where customer conversion is at its weakest and how the ROI for a campaign can be improved.
Reach
KPIs related to content reach track how far an article travels – how many eyeballs see your content and how much traffic it pulls in.
These are generally the easiest metrics to track directly – you’ll have access, for example, to the number of pageviews that each article on your blog gets, which means you can see directly which articles are producing the best results.
Beyond this, though, you’ll also want to know which types of content travel furthest, so that you can determine which ones to focus on when it comes to distribution.
Not all types of content are equally effective at drawing in new site visitors, so it’s crucial to find out which kinds of content perform the best from the start.
Tools for Understanding Traffic Data
There are a lot of tools out there to help make the most of your data:
- Tools like Google Analytics’ Content Drilldown can help with this by letting you see not just which website pages bring in the most traffic, but also which pages within your website are most often visited.
- You’ve also got the option to use resources like Traffic Sources and other similar tools which provide detailed breakdowns of your most profitable visitor streams.
These tools help you not just to put numbers against your site’s traffic, but also help to provide a more detailed understanding of what content is drawing in new visitors, and what sources they’re coming from.
Engagement
Analyzing your content’s engagement is a bit more complex than understanding its reach, and that’s why many content marketers struggle to make the best use of numerical data relating to the behavior of new leads.
While a website may have a very wide visitor base, only a small fraction of these visitors will go out of their way to engage – to comment, to share content on social media, or to sign up and read email newsletters.
Things here also aren’t very clear cut because there are varying degrees of engagement that a person can show:
- A follow on Twitter, for example, is six times less useful from a sales perspective than an email subscriber.
It’s not enough to just focus on the number of social media followers a brand has – it’s important to get a sense of how many of those followers are actively invested in the company and its content.
Tools for Understanding Engagement
The first statistic that marketers often reach for when analyzing engagement is a piece of content’s bounce rate – do site visitors quickly visit a site and then disappear, or does the content grab their attention and tease them enough that they want to know more?
In my experience, it’s also helpful to use resources to spot which parts of a site users tend to engage with more often. These can include:
- heat maps which give site hotspots
- eye tracking tests which show where users like to look

Visual data isn’t an easily-tracked metric which can translate into KPIs, but it can provide a better understanding of what site visitors are drawn to.
Instead, behavior metrics can be tracked to measure engagement. These include:
- Social media follows and engagement
- Article comments
- Email subscriptions
These can also be tracked through various means in order to give a good picture of how many site visitors are inspired enough to want more content.
Monitoring Sincerity
That said, the number of followers a brand has can often provide an inflated idea of a company’s popularity, depending on how many of those followers are actually willing to make purchases.
For that reason, I’ve found that the best engagement KPIs to choose are the ones that give you a good idea of how many leads are actually showing a sincere interest in your brand, rather than those who only have a passing interest.
Looking at the numbers for your site traffic and content reach in comparison to the number of repeat site visitors gives a good indication of how good your content is at encouraging engagement.
If your site draws in a lot of visitors but few of them ever return, it suggests that your content may not be providing the best ROI, in spite of its reach.
Conversion
All other KPIs point to the one that counts: how many new or repeat customers has your content generated?
Trace the path that your customers are taking:
- from their first discovery of your content,
- through their period of engagement and preparation,
- and onto the point where they make their first purchase.
You’ll be able to better interpret your sales numbers and get a clearer understanding of how they’ve been influenced by your content marketing campaigns.
As with KPIs related to engagement, your conversion statistics can help you understand if there’s any part of the customer sales process that your content marketing is failing to encourage.
If your site’s visitors are active, constantly engage with the brand and take time to give regular feedback, but don’t go through with sales purchases, it may mean that some element of your content needs to be adjusted to provide better support for established site visitors who are already familiar with your brand and its selling points.
First-time sales alone aren’t the final target of your content marketing efforts.
It’s important to also keep track of returning customers – those who are so inspired by your content that they return often enough to make repeat purchases.
Again, by comparing the number of first-time customers with the number of repeat customers your business receives purchases from, you can see how well your content is doing at reaching those who have already begun to buy from you.
Reverse Engineering a Value
Using the KPIs for initial site visits, engagement and sales, it’s possible to work out exactly how much value you’re getting from your content marketing, beginning by analyzing your regular customers and determining how much they’re worth over the course of your brand’s lifetime.
- There are tools such as the Customer Lifetime Value calculator which help with this process, so it doesn’t take too much effort to get a picture of how much revenue each of your customers will generate.
Using this number and a little math, you’re able to see how much each social media follower is worth to your business, as well how much revenue each piece of content generates.
Here’s an example:

Say you have:
- Ten customers who are worth $1,000 each over the course of your company’s lifespan (we’re working with small numbers here to keep things simple).
- These ten customers were generated from around 1,000 followers on social media.
- There are 100 followers for every one customer, which makes every follower worth $10 each
- Gaining another 100 followers will result in, on average, one new customer and $1,000 of revenue.
Say that:
- One in every 100 site visitors follows you on Twitter (again, these simple numbers for easy math).
- That means that every site visitor is worth 10 cents
- It’d take 100 site visitors to produce a social media follower, and 10,000 visitors to produce a new customer.
From here, you can work out the value of your content in drawing in an audience.
- If a piece of content brings in 500 visitors, it’s produced about $50.
- If it brings in 10,000 visitors, it’s produced a new customer all by itself and has made you $1,000.
While these numbers are a bit basic, working out how much revenue each customer produces and how many customers each piece of content brings in will give you a general idea of how much ROI you’re getting from your content.
In reality, it’s been found that websites that produce 15 blog posts per month generate an average of 1,200 new leads in the same time period, meaning that on average, a blog post is worth around 80 leads – although the exact number will vary from brand to brand.
Of course, not all content is equally engaging and equally likely to lead to sales – some content may draw in large numbers of site visitors but few of them stick around.
For this reason it’s also important to measure the relative bounce rates of each piece of content, along with other statistics, to get a better idea of how much each individual piece of content is benefiting your brand.
Calculating the Cost of Content

As good as it might be to have high rates of engagement and for your content to be producing a lot of sales, it’s important to keep things in context and weigh up the value your content is providing for the money you’ve spent to produce it.
Tracking the cost of content is a lot easier than working out how much revenue it generates.
It’s important to keep an eye on how much you’re spending versus your returns, though, to make sure that your content efforts are as profitable as possible.
This is another instance of the importance of knowing how valuable different types of content are. Video content, for example, is a lot more expensive to produce than text, but typically leads to more sales, and better engagement, as visitors stay two minutes longer on sites with after having watched video content.
It’s important, then, to know whether the benefits to visitor traffic and engagement outweigh the added cost of producing video content for your site:
If you’ve outsourced your content creation efforts, measuring the cost of your content is as simple as:
- Adding up what you’ve spent
- Making an allowance for the time you’ve spent delegating and reviewing this outsourced work.
If all of your content has been produced internally, estimate its cost according to:
- The hourly rates of the workers involved
- Multiplied by the number of hours required to produce it
- Again, don’t forget to include some accommodation for the cost of your own time in organizing content creation projects.
As different pieces of content generally have a cumulative effect on sales, it’s not always easy to sort out what content brings in the most money – content marketing in general is a slow burner, with effects lasting far longer than paid ads or more immediate marketing solutions.
Marketers who keep an eye on their KPIs, though, are able to get a general idea not only of how valuable their collective content marketing efforts are, but also each individual piece of content, compares with its relative production and distribution cost.
Comparing Against Other Forms of Marketing
Content marketing doesn’t exist in a bubble.
Everybody wants to know that they’re making the best possible use of their marketing budget, and that means gaining a real-world financial value for content compared against other forms of marketing.
Content marketing is often compared against paid ads, even though both forms of marketing are very different:
- Unlike paid ads, if you stop paying for content, you don’t instantly lose all inbound assets.
- On the whole, content marketing builds other benefits, such as brand trust, as well as directing traffic to your site.
Using various analytics tools, it’s possible to see how the cost of a content marketing campaign compares with a paid ad campaign of similar success.
Because with pay-per-click paid ads it’s possible to select your desired visitor traffic when you budget your campaign, many marketers use tools to find out how much their content marketing would have cost if they’d simply used AdWords instead.
These tools include like:
Typing in the keywords that a piece of content focuses on and setting the number of clicks to match visitor site traffic gives an indication of what Google of Facebook would charge for a similarly successful paid ad campaign.
These tools can give a good insight into the relative cost of content marketing endeavors and can help marketers to ensure that they’re getting the best possible return on their investment relative to other, alternative forms of marketing.
Weighing Cost Against Revenue: Finding Your ROI
So now, let’s go back to our earlier simple math and see if we can work out an ROI for a piece of content…
Earlier, using some basic numbers, we worked out that, hypothetically:
- If a customer earns the company $1,000 over its lifetime
- If it takes 10,000 site visitors to make a new lifetime customer
- Each site visitor is therefore worth 10 cents.
For each piece of content, then, it’s important that the number of visitors it attracts is greater than the cost of the content itself.
Cost will vary, but for this analogy, let’s say that we’re paying:
- $100 for a text article
- $250 for an infographic.
We can see from our analytics stats that each new piece of text content generates 1,000 new site visitors:
- That means that each piece of content is worth $100
- This is exactly what we’re paying for it, for a neutral ROI.
Alternatively, an infographic brings in on average:
- Around 20,000 visitors
- Each of whom is worth 10 cents
- This makes the ROI for an infographic around $2,000
- This is far more than the cost of producing the content, resulting in a net positive ROI.
These numbers are really basic, so let’s have a quick look at Siege Media’s far more detailed ROI calculator.
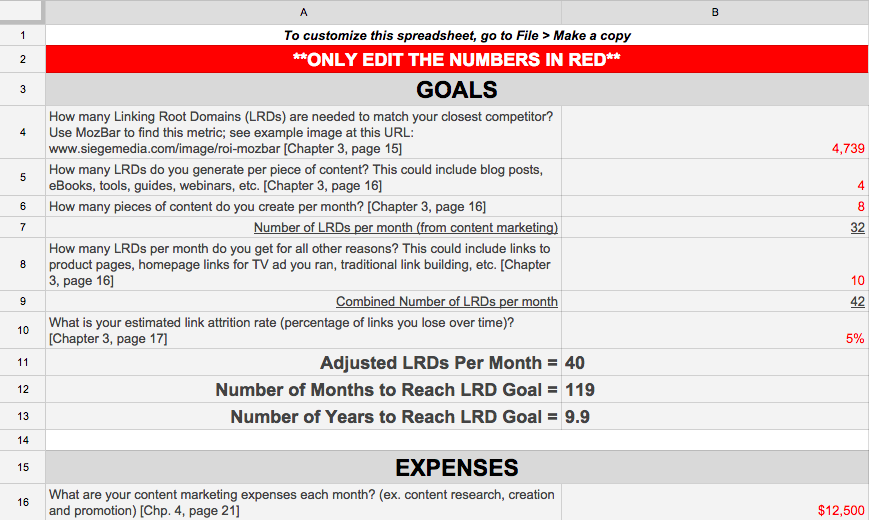
This calculator tracks:
- Your goal for the number of pieces of content you generate per month
- The cost of each piece
- Your competitors’ content output
- Your target revenue
The calculator then gives a prediction on how long it’ll take to begin seeing a positive return on investment, as well as forecasting what you’ll be earning over the years from your marketing efforts.
(If you want to get even more specific on your ROI calculations, check out the full formula here.)
It’s important to note, however, that not only is this math very basic, it also overlooks the customers who’ll visit your site several times before making a sale. It also ignores externalities such as brand awareness, which is difficult to put an exact number on.
As far as a basic way of predicting how much ROI each piece of content is generating at minimum, though, this is enough to get us started. Any additional sales are a nice bonus, but they can’t necessarily be tracked.
Beware the Chocolate Effect
The last thing I want to touch on before leaving you is a caution that much of the practice of analyzing content marketing stats relies on conjecture.
While it’s sometimes pretty clear how much initial traffic and online engagement a piece of content has attracted, it’s not always easy to see just how that these figures add up.
- Some customers engage several times with a brand before they actually make a purchase.
- Others become lifelong patrons almost immediately.
There’s no sure way of knowing what can be done to improve all aspects of a customer’s journey with your company.
One interesting story from the world of academic research makes it pretty clear that you can’t always trust an initial reading of statistics.
A writer and scientist published an article earlier this year explaining how, in order to prove how easy it is to create a scientific hoax, he’d deliberately misinterpreted the data in an experiment to show that chocolate helps weight loss.

Despite the fact that the “science” conducted by John Bohannon – posing as Johannes Bohannon, Ph.D. – was egregiously terrible, the story was picked up by the world’s press, who took his analysis at face value, failing to spot his use of irony.
I’m sharing this with you not to disappoint you about chocolate’s non-existent impact on weight loss, but to show you how easy it is, when focusing on statistics and numerical data, to overlook the bigger picture.
Marketers who want to gain a full understanding of the ROI their content is providing need to:
- Approach analytics with an impartial view
- Must avoid drawing conclusions based on incomplete data.
Not everything about content marketing lead generation and customer conversion can be traced to a simple cause and effect – for that reason, it’s not always easy to accurately measure the ROI a piece of content produces.
That said, marketers who keep a close eye on
- their site traffic
- visitor behavior
- visitor engagement, and
- visitor purchasing choices,
will be able to draw patterns to get a good idea of how effective their content marketing efforts are proving to be.
What’s more, close examination of statistics for individual keywords and pieces of content can give a good indication of how much money a piece is producing, relative to other forms of advertising and other types of content.
If you’re consistent about measuring and analyzing your data, you can use analytic tools to get a pretty good idea of how effective your content marketing campaigns have been.
Do you make content marketing ROI measurement a priority? If so, share how you capture and use that information by leaving a comment below:
Images: Content Marketing Institute, NewsCred, SmartInsights, BestToolBars, Pixabay, Flickr, Flickr, Flickr, Pixabay, Pixabay, Content Siege, Pixabay
