


Is your content making a solid return on your investment?
I know it’s not always possible to clearly measure how much money content marketing efforts make when compared with how much they cost to produce and distribute, and that it’s difficult to track what content leads to conversion.
That said, I’ve found that, with some smart calculations, it’s possible to work out how well your content is performing and what financial success it’s having.
The key is to track the right metrics.
With that in mind, I’m going to use today’s post to break down which numbers you should be keeping an eye on, as well as how you can use them to track conversions and measure sales.
First, a Word on Sales
The most important conversion metric that should drive everything you do in content marketing should be sales.
- If your content is drawing in a load of traffic but it’s not leading to conversions or sales, it’s not meeting your needs.
Because of this, the most important metric for tracking your ROI is your sales. You should always be looking for ways to use your content to increase the amount of revenue you’re earning.

The problem is that it’s not always easy to tell what content leads directly to sales, which can make it hard to track your most useful materials.
- It’s rare for a single piece of content to lead customers directly to making a purchase – normally it’s a cumulative effort from several pieces of content and other marketing materials.
- Focusing just on what content leads directly to sales means ignoring all the extra benefits your content will produce in leading customers to your business, such as building brand recognition and helping customers develop a relationship with your company.
As it’s not possible to track all the benefits of your content, I’ve found that it’s important to focus on metrics that can point you in the direction of understanding how financially useful your efforts are proving to be.
To do that, you’ll need to take a look at a few key metrics that’ll help build a better picture of how your content is contributing to your sales.
Customer Value
While metrics are important when it comes to helping you to understand how well your content is performing, ultimately you’re not looking to improve numbers: you’re looking to attract people.
- Each person who engages with your content is represented by a few trackable metrics, but learning about that person and their purchasing habits can be difficult.
- The most important metric – the amount that each customer will spend on your products in total – will depend on how often they come back to make repeat purchases.
- For this reason, if your content only attracts a single customer but they buy from you regularly over many years, that’s more beneficial than several customers who only make purchases once.
Working out how much each customer will spend in total of the lifetime of your campaign can be difficult.
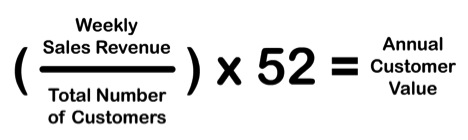
It helps to work out the average spend for each customer per week, and then multiply this by 52 to discover how much they’ll spend over a year.
- Take your sales figures for the entire week – what was your total earning for this period?
- Divide this number by the number of existing customers who’ve made any purchases at all in the past year, even if they didn’t buy anything this week.
- Multiply this number by 52 – this gives you an approximate figure for how much each customer might spend over the course of a year.
So if your company earns $4,500 in a week and has 30 customers on its books, over the course of a year you can expect every customer to generate approximately $7,800 for your business.

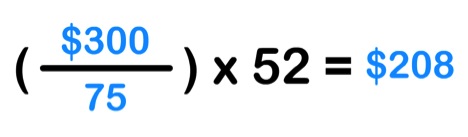
Alternatively, if your company pulls in around $300 a week and has 75 regular customers, each customer generates somewhere around $208 dollars annually.
If you know the average number of years a customer will buy from you, this calculation can also show you what each customer’s lifetime value is to your company.
- Be careful, though – your lifetime customer values often be little more than a prediction as it’s difficult to know in advance how long customers will be buying from you.
I should stress that these numbers are a very simple way of working out this metric, and work best for a company with a fairly static customer base size.
- If you’d like to see some more complex methods for working out the value of a customer, I’d recommend this infographic from Kissmetrics.
- The infographic goes through the calculation above in a bit more detail and offers some alternative methods for working our customer value.
Knowing your customer value means you can make some progress in identifying the return you’re getting from your investment.
Based on the amount that each customer pays you over a year, and based on how many new customers your content is bringing in, you can work out what each piece of content generates in terms of sales and repeat customers.
To figure this out, we’ll need to look at your site’s traffic and other related metrics.
If you’re looking for some extra guidance on the concept of customer value, these resources will help:
How To Calculate & Increase Customer Lifetime Value by ConversionXL
How To Calculate Lifetime Value – The Infographic by KISSMetrics
Page Views
The classic direction to take when looking to work out the ROI for your content, and the best place, to start, is to look at the effect your content has had on page views for your site as a whole.
- The more page views your content receives, the more people will interact with your content, and the greater the chance that someone will make a purchase.
If you’ve worked out your average value for each customer, it’s possible to use your page views to work out the relative return on your investment that you’re getting from each piece of content.
It’s simple to translate this metric into an approximate revenue per page view.
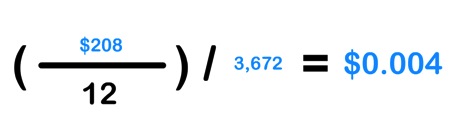
- Taking your average annual customer value, divide this amount by twelve to find out how much each customer makes you on average every month.
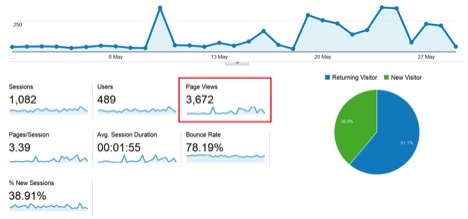
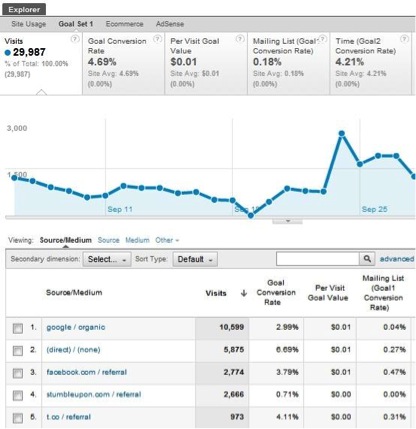
- Divide this number by the number of page views you’ve received in that month, as tracked by analytics software (as seen above).
- This will help you to figure out how much each individual page view is worth.

So if your average customer generates $7,800 for your company annually, and your website is getting 3,672 views per month, each view is worth 17 cents in potential revenue.

Alternatively, if you’re making $208 off each customer every year, and you’re averaging 3,672 page views a month, each page view is worth 0.4 of a cent.
Using this calculation, you can then work out how much money each piece of content is making, by working out how much potential traffic you’re gaining from it.
Analytics tools like Google Analytics break down the popularity of each page on the site.
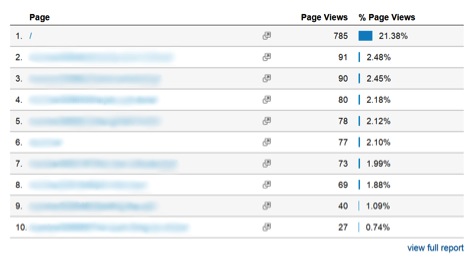
From this you can learn how many page views each piece of content receives.
- By multiplying each piece’s page views by the average revenue per page view, you can find out what you’re earning from each piece.

So if your average revenue per page view is $0.17 and you receive 91 page views, you’ll generate $15.47 for that piece of content in a month.
A more popular piece of content which generates 1,500 views will instead generate $255 of revenue within a month.

Alternatively, if your page views are only generating 0.4 cents each, 91 page views are worth $0.364 and 1,500 views are worth $6.

You can therefore use these calculations to work out how your page views are translating into genuine revenue for your business.
- Based on how much your content cost to produce, you can work out how this number compares to your ROI for each piece of content.
You should use this to identify which pieces of content are generating the most revenue for your business.
Social Media Interactions
Similar to how you can use your individual content page views to work out how much each piece of work is generating for you, it’s possible to use social media to get an idea of how much return you’re getting for the resources you put into advertising through Facebook, Twitter and other similar tools.
Breaking down social media progress and assigning a number to your progress isn’t something that many companies like to focus too hard on.
- 44% of companies only rely on anecdotal evidence to measure social media success.
- This is primarily because it’s difficult to track the success of a particular social media post in terms of sales and financial benefits.
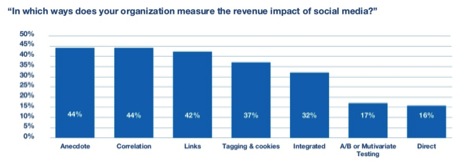
This being the case, plenty of companies instead like to focus on the various unquantifiable benefits to maintaining a healthy social media presence.
- These benefits can include increased community insight and decision making.
- Only 32% of companies feel that they receive a beneficial financial impact from their social media.
While building your brand’s reputation is very helpful, it is possible to measure the ROI that your online presence brings in.
- Those companies that find ways to measure the financial benefits of their social media are the ones who are in the position to make the best possible use of their social media campaign.
If you’ve already worked out your average revenue per customer and your average value per page view, it’s actually very simple to get an idea of just how much revenue your social media efforts are bringing in.
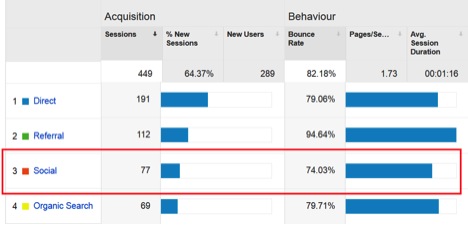
In Google Analytics, under the Acquisition Overview, there’s a breakdown of the places traffic is coming from in order to arrive on your site.
- One of these traffic sources is social media.
- There’s even a handy pie chart to show what proportion of your traffic comes from social media.
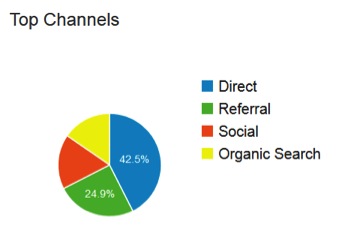
Within this tool, you’ll be able to see a breakdown of each form of social media, and how many unique sessions and page views each one generates.
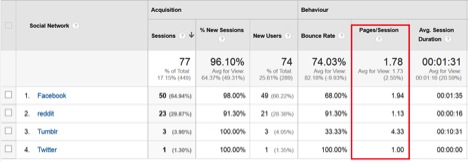
To work with the numerics we’ve already been tracking, we want to look at the Pages/Session metric.
- For example, in the example above, Facebook has brought in 50 sessions with an average of 1.94 pages per session.
- 94 x 50 = 97, meaning that over the past month Facebook has brought in 97 page views.
- Now it’s just a matter of using our existing calculation to work out how much revenue each of these page views have generated for us.

In this example, 97 page views is worth either $16.49 or almost 39 cents, depending on the average value of each page view.
- The Analytics screenshot above shows that Facebook and Reddit are the most successful social media tools for this website.
- Tumblr and Twitter efforts are proving less financially viable, meaning that the company in question should alter their approach for these platforms.
For any company looking to spot how well their social media is performing and what the real value of their campaign is, it’s useful to use these tools and calculations to get an idea of the number of conversions that each social media platform is bringing in on average each month.
For some more in-depth information on tracking the ROI of social media, you may find these articles helpful:
The Delightfully Short Guide to Social Media ROI by Buffer
How to Measure Social Media ROI by Social Media Examiner
The Automatic Alternative
The numbers we’ve been working with in this article have been fairly basic, and we’ve only been working the metrics for individual posts – but what if you need to break things down for a lot of content all at once?
- To get better insight, it’s possible to enter a lot of the details we’ve been discussing into analytics tools to track conversion rates automatically.
Entering your average conversion value means that tools like Google Analytics will track your return on investment from each traffic source automatically, taking a lot of the difficultly out of working out values.
If you’d like an even more detailed breakdown of your social media efforts, I’d recommend trying out True Social Metrics.
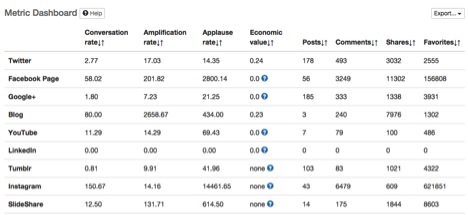
This tool helps you to track not just how many hits you’re getting from each social media platform, but it can be used to track social shares as well, in addition to providing an economic value for each tweet or post you make.
These tools can be used to streamline your conversion tracking and ROI calculations.
One Final Thing
Just in closing, I want to point out one last time that while the numbers are important, they don’t tell you everything.
- Your content marketing campaign is more than the sum of your financial investments.
- It often takes a while to get the ball rolling, meaning that your content won’t produce a solid return on your investment at first.
I’d recommend using the metrics and calculations in this article as a guide to show you what’s working, but don’t worry too much if you’re not instantly seeing the results you want.
As long as you keep a close eye on these metrics and tailor your content to help them grow, your content will lead to phenomenal conversion in the long run.
What do you use to track conversions? Which metrics are the most important? Share your thoughts in the comments below.
Images:
Pixabay, Pixabay, Google Analytics, SlideShare, Google Analytics, Sprout Social, True Social Metrics.
